

Every business produces data from sales, customers, enquiries, finances, websites, applications, and marketing campaigns. However, information is of little use until it has been organised, analysed, and presented in a way that is useful to people.
A Microsoft Fabric Data Analyst is someone who makes businesses understand this information. This involves connecting data from different sources, preparing and analysing this information, and using reports to make decisions.
If you already have experience with Excel, SQL or Power BI or you are a complete beginner, this role guide will help you understand the role and what to do to prepare for it.
What Is Microsoft Fabric?
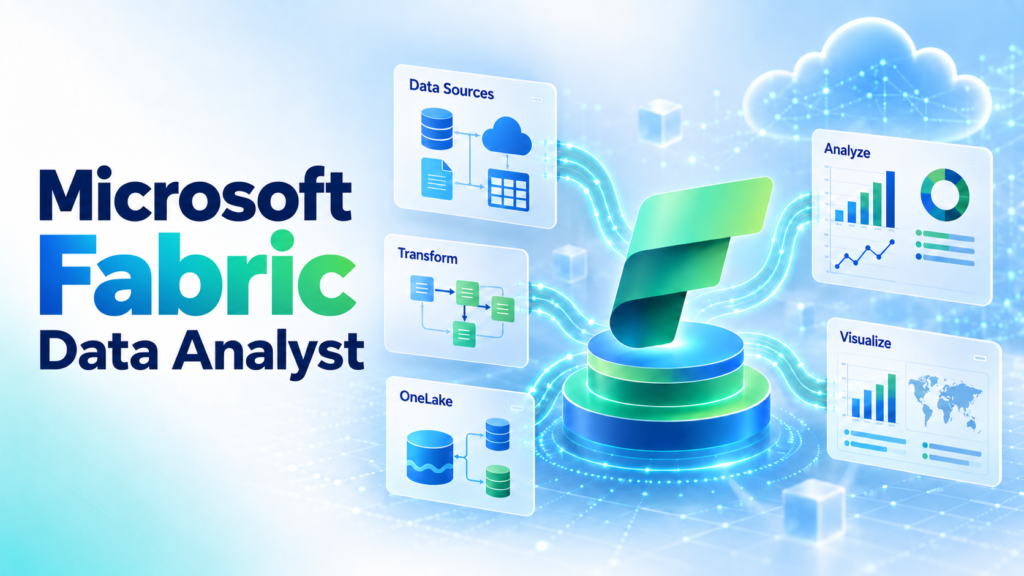
Microsoft Fabric is Microsoft’s unified data and analytics platform that combines data integration, data engineering, data warehousing, data science, real-time analytics, Power BI, and data governance.
In the past, businesses would use separate platforms to collect, store, process, and analyse data. This led to extra work for data teams and made it more challenging to collaborate. Microsoft Fabric brings these activities together to enable analysts, engineers, data scientists, and business users to work within a connected ecosystem.
At the centre of the platform is OneLake, a unified storage layer for organisational data, enabling different Fabric workloads to access and use this information without having to create unnecessary copies.
Who Is a Microsoft Fabric Data Analyst?
A Microsoft Fabric Data Analyst transforms a company’s data into reports, dashboards, and insights.
A company may ask:
- What product makes the most money?
- What branch or area is doing well?
- Why did sales drop this month?
- What marketing campaign led to the most lead?
- What percentage of customers came back to buy something again?
- What department is overspending?
The analyst will have to identify what data to use, assess its quality, create relevant calculations, and present the information in Power BI.
However, a Microsoft Fabric Data Analyst is not just about creating aesthetically appealing dashboards. The individual has to understand what the business requires and what the report says to support a specific agenda.
What Does a Microsoft Fabric Data Analyst Do?
The duties of a Fabric Data Analyst can vary depending on the organisation and project type. Generally, it is a mixture of the following responsibilities.
Understand Business Requirements
Before creating a report, the analyst has to speak to managers, clients, or stakeholders to understand what they want.
For instance, if a sales manager asks for a dashboard, the analyst has to ask:
- What KPIs do you want to monitor?
- Who will use this report?
- How frequently should this information be updated?
- What time frame, location, and products should be compared?
- What decisions will this report support?
This will help the analyst avoid creating a dashboard that looks good but does not solve an actual business challenge.
Connect to Business Data
A business will have different data sources, such as Excel files, SQL databases, CRM platforms, ERP systems, cloud applications, and other sources.
A Fabric Data Analyst has to understand how to connect to this information and bring it into the Fabric ecosystem. Depending on the project requirements, the data may be stored or accessed from OneLake, a Fabric Lakehouse, a Fabric Warehouse, or a mirrored database.
Clean and Prepare the Data
Data in the real-world is messy, with duplicated rows, blank values, typos, and incorrect formats.
Before diving into analysis, a Microsoft Fabric Data Analyst has to prepare the information so that it is fit for analysis. This can involve deduplication, fixing the data types, addressing missing values, combining information from different sources, splitting or merging columns, categorising values, and deleting unimportant information.
Power Query, Dataflows Gen2, and SQL are commonly used for this task.
Organise Data for Analysis
Once the data has been cleaned, it has to be prepared for analysis. This involves organising the tables and establishing relationships between them.
For example, a sales model will have a table for transactions, customers, products, locations, and dates. Correctly organising this information will ensure that an analyst can find revenue by product, customer, location, or time without getting incorrect results.
This organised analytical layer is known as a semantic model. It stores tables, relationships, business definitions, calculations, and security rules that Power BI reports consume.
Create Business Calculations
A report is more than just summary statistics. A manager will be interested in revenue growth, margins, average order value, customer retention, and achievement rates.
Microsoft Fabric Data Analysts use DAX (the calculation language in Power BI) to create these calculations. The individual will also have to validate that every calculation follows the business rules.
Build Power BI Reports
Once the data has been prepared and organised, the analyst designs reports in Power BI.
A report should:
- Highlight the most important information
- Use informative charts and graphs
- Have useful filters
- Have a good visual hierarchy
- Be quick to load
- Easy to navigate
- Avoid unnecessary information
Drill-through, tooltips, bookmarks, and conditional formatting can be added to help users get more information. However, analysts should not add features for the sake of aesthetics.
Protect Sensitive Information
A business report may have sensitive information about customers, employees, sales, or finances.
A Microsoft Fabric Data Analyst can use row-level security to ensure that users only see information that they are allowed to view. For instance, a regional manager should only be able to see their region’s data.
The analyst can work with administrators and governance teams to ensure that reports follow these policies.
Test and Maintain Reports
A report has to keep working correctly long after it has been built. The analyst has to routinely test:
- If the latest information is being used,
- All calculations are working,
- Visualisations are displaying the information correctly,
- Security is working as expected,
- The report is performing well,
- The business definitions still make sense.
Besides, reports have to change to reflect a company’s new products, targets, departments, or reporting requirements.
Important Microsoft Fabric Concepts for Beginners
Microsoft Fabric has many components, but beginners do not have to learn everything at once. The following concepts are a good starting point for understanding the platform.
OneLake
OneLake is the central data storage layer in Microsoft Fabric. It provides a common location for a company’s data and supports different Fabric workloads.
It is similar to OneDrive but for enterprise data, meaning organisations do not have to keep multiple copies of information. Authorised users and services can work with this information without having to make copies.
Fabric Lakehouse
A Fabric Lakehouse combines the characteristics of a data lake and a data warehouse.
It can store structured information, such as sales tables, unstructured data, and semi-structured information. It gives organisations a flexible environment to store and analyse large amounts of information.
Fabric Warehouse
A Fabric Warehouse is designed for structured, relational data and SQL-based analytics. It is ideal for reporting scenarios where information is organised into clearly defined tables and relationships.
Professionals with good SQL knowledge and those familiar with traditional data warehouses can work with Fabric Warehouse while using familiar concepts.
Dataflows Gen2
Dataflows Gen2 helps users connect, clean, and transform data using a low-code interface. It uses the familiar Power Query experience and can load the prepared information into different Fabric destinations.
For analysts, it is a convenient tool to create reusable data-preparation processes.
Semantic Models
A semantic model makes technical data understandable to a business user.
For instance, database fields can be changed to business-friendly terms, such as Revenue, Customer Category, or Monthly Target. It also defines relationships between tables, calculations, formatting, and security.
Direct Lake
Direct Lake enables Power BI semantic models to analyse data in OneLake without having to import a copy of this information into Power BI.
It can be beneficial for organisations that work with large datasets or frequent updates, as it reduces the distance between the information stored in Fabric and the reports used by analysts.
Mirroring
Mirroring continuously synchronises data from external systems into Microsoft Fabric with low latency.
In traditional analytics projects, companies will have to design and maintain ETL (extract, transform, and load) pipelines to move operational data into an analytics platform. Mirroring can simplify this process for supported sources, making the latest information available in OneLake.
For a Fabric Data Analyst, this means faster access to operational information and report development. However, the data has to be validated, organised, and modelled before it can be analysed and used to make decisions.
Skills Required to Become a Microsoft Fabric Data Analyst
A beginner should focus on developing a blend of technical, analytical, and communication skills.
Data Fundamentals
A beginner should understand how data is stored and organised. This includes learning about:
- Tables, rows, and columns
- Data types
- Primary and foreign keys
- Databases
- Structured and unstructured data
- Transactional and analytical systems
This will make it easier to understand SQL, Power BI, and Fabric.
Excel
Excel is a useful tool for data analysis, as it helps a beginner to understand formulas, tables, filters, sorting, pivot tables, and data cleaning.
Excel alone will not be sufficient for enterprise analytics, but it provides a good foundation before databases and cloud platforms are introduced.
SQL
SQL is essential for getting information from databases and Fabric Warehouses. Important topics include:
- SELECT statements
- WHERE conditions
- Sorting and filtering
- Joins
- GROUP BY
- Aggregate functions
- Subqueries
- Common table expressions
- Window functions
The best way to learn SQL is by practising business questions instead of memorising syntax.
Power Query
Power Query helps analysts connect to and transform data. It can be used to remove errors, change formats, combine tables, and prepare information for reporting.
Power Query is a valuable skill to learn, as the same transformations can be applied in Power BI and Microsoft Fabric.
Power BI
Power BI is a core reporting tool in Microsoft Fabric. A beginner should learn how to:
- Connect to data sources
- Create relationships
- Develop measures
- Choose suitable visualisations
- Add filters and interactions
- Publish and share reports
- Improve report performance
- Apply security
The aim is not to use every visual Power BI provides. It is to build reports that communicate information clearly.
Data Modelling
Data modelling determines how information is organised for analysis.
A Fabric Data Analyst has to understand fact tables, dimension tables, star schemas, relationships, and cardinality. Good modelling practices prevent incorrect calculations and help reports perform better.
DAX
DAX is used to create measures and analytical calculations in Power BI semantic models.
A beginner should start by learning aggregation functions for totals, counts, and averages. Once evaluation contexts are understood, more complex functions for filtering, comparisons, and time-based analysis can be explored.
DAX is easier to learn using business questions rather than isolated calculations.
Business and Communication Skills
A technically correct dashboard is of little use if stakeholders cannot understand it.
A Fabric Data Analyst has to be able to:
- Ask the right questions
- Understand business processes
- Explain findings in simple language
- Present recommendations clearly
- Document calculations and definitions
- Communicate limitations in the data
These abilities make the difference between a report developer and an effective data analyst.
How to Become a Microsoft Fabric Data Analyst
Learning the tools in the right order can make the process easier.
Step 1: Build a Foundation in Data
Understand how tables, databases, and business records work. Learn the difference between data created by day-to-day operations and data prepared for analysis.
Step 2: Practise SQL
Use datasets related to sales, customers, inventory, finance, or employees. Practise answering business questions using queries rather than memorising syntax.
Step 3: Learn Data Preparation and Reporting
Use Power Query to clean data and Power BI to create your first reports. Start with simple dashboards before adding advanced interactions.
Step 4: Understand Modelling and Calculations
Learn how to organise data using a star schema. Then, create measures for KPIs, such as revenue, profit, growth, and target achievement.
Step 5: Move into Microsoft Fabric
Once you understand the basic analytics workflow, explore how Fabric manages data using OneLake, Lakehouse, Warehouse, Dataflows Gen2, and workspaces.
Instead of studying every component separately, follow the complete journey of data from its original source to a Power BI report.
Step 6: Explore Modern Fabric Capabilities
Learn how Direct Lake connects semantic models to OneLake data and how Mirroring brings supported operational data into Fabric.
Understanding why these features are used is more important for a beginner than memorising every option.
Step 7: Complete End-to-End Projects
Projects help you connect individual skills and understand how analysts work in real-world scenarios.
- A complete project may include:
- Identifying a business problem
- Connecting to the required data
- Cleaning and transforming the records
- Organising the analytical model
- Defining relevant KPIs
- Creating a Power BI report
- Applying access controls
- Testing the results
- Presenting the final insights
Document the objective, process, and outcome of each project. This makes the work more useful when building a portfolio or preparing for interviews.
Do You Need Coding Experience?
You do not need a programming background to start a career as a Microsoft Fabric Data Analyst.
SQL, Power Query, and DAX require writing queries, expressions, or formulas, but these can be learned gradually. Many common tasks can be completed using the visual interfaces available in Power BI and Fabric.
Python can be useful for advanced analysis, automation, and data science, but it is not the first requirement for most entry-level analyst roles. Build a strong foundation in data, SQL, modelling, and Power BI before adding Python to your learning plan.
Career Opportunities in Fabric Analytics
Microsoft Fabric skills can support several careers, such as:
- Microsoft Fabric Data Analyst
- Power BI Developer
- Business Intelligence Analyst
- Reporting Analyst
- SQL Data Analyst
- Data Visualisation Developer
- Azure BI Analyst
- Junior Fabric Analytics Engineer
The job titles and expectations can vary between companies. Some roles may focus mainly on Power BI, while others may require experience with Lakehouse, Warehouse, Fabric data preparation, and governance.
Always read the job description to understand which skills are prioritised in the roles you want.
Final Thoughts
Becoming a Microsoft Fabric Data Analyst is not about learning every platform feature at once. It is about building a strong analytical foundation and understanding how data moves from a business system to a decision-ready report.
Start with data fundamentals and SQL, such as learning how to clean information, organise it into a reliable model, and communicate insights in Power BI. Once these skills are well understood, explore how Microsoft Fabric connects the analytics process using OneLake, Lakehouse, Warehouse, Dataflows Gen2, Direct Lake, and Mirroring.
Most importantly, practise with end-to-end projects. Real progress is made when you can take a business question, find the relevant data, and present an answer people can understand and act upon.
To gain practical experience in Microsoft Fabric Analytics, Power BI, Power Query, SQL, data modelling, and real-time projects, contact KSR Datavizon to learn more about its classroom and live online training options.


Most Commented